역시 LG경제연구원 보고서입니다.
헬스케어 영역으로 로봇이 대두될 것이란 기사입니다.
과연?
아래 파일을 클릭하시면 PDF가 열립니다.
LG경제연구원의 11월 29일쯤 연구 기사입니다.
전기자동차가 거의 몇년만 있으면 20%의 MS를 가질거라는군요.
전지산업이 각광을 받을거랍니다.
으흐.
과연..
아래 파일을 클릭하면 PDF가 열립니다.
CMCC(China Mobile)가 4G plan에 대하여 뭔가 계획을 내놨군요.
TDM LTE를 사용한 시스템을 런치할 예정인 듯 합니다.
현재 Huawei와 Motorola가 DEMO를 성공한 진도인데요.
ALU를 선정해서 시도하는군요. ALU는 FDD LTE도 잘 하질 못하는데.
개네는 물량만 절라 싸아놓고 질이 어떤 시스템을 내보낼지 걱정입니다.
아무튼 아래 기사는 Zack Research에 올라온 블로그 기사입니다.
11월 20일자 기사이네요.
=====================================================================
By: Zacks Equity Research
China Mobile (CHL - Analyst Report), the world’s largest wireless carrier by subscriber, has revealed its plan to commence the trial run of its 4G network during World Expo 2010 to be held in Shanghai from May 1 to Oct 31, 2010. The company’s 4G service is based on the TD-LTE (Time Division Duplex Long Term Evolution) mobile broadband technology. Roughly 200 participants and 70 million visitors are expected to assemble at the Expo.
China Mobile has recently selected Alcatel-Lucent (ALU - Analyst Report) for the responsibilities of design, construction, installation and integration of communication infrastructure to facilitate the 4G network trial. The TD-LTE network will provide advanced wireless services (including high-definition TV and ultra-fast broadband Internet access) to the visitors at the exposition.
The three major Chinese telecom operators China Mobile, China Unicom (CHU - Analyst Report) and China Telecom (CHA - Analyst Report) are investing heavily in Shanghai to improve the city’s network infrastructure, thereby ensuring the delivery of smooth network coverage for Word Expo 2010. China Mobile plans to invest RMB 15 billion ($2.19 billion) over the next three years in Shanghai.
China Mobile’s TD-LTE venture is being supported by the British telecom giant Vodafone (VOD - Analyst Report). In addition to Alcatel-Lucent, the company has also selected Ericsson (ERIC - Analyst Report), Motorola (MOT - Analyst Report), Nokia Siemens, Huawei Technologies and ZTE Corp as the primary technology vendors for the upcoming 4G project in Shanghai.
China Mobile’s TD-LTE network will enable downlink speeds of 60 megabits per second (Mbps), which is 20−30 times faster than the average throughput levels offered by existing 3G networks. China Mobile plans to allocate approximately 60% of its capital expenditure over the next few years to develop its 4G network.
The company’s recently accelerated development plan for TD-LTE stems from the uncertainties related to the success of its TD-SCDMA technology based 3G services. China Mobile is facing challenges regarding the adaptability and performance of this indigenously developed 3G standard.
European and American 3G standards such as WCDMA and CDMA2000, which have been adopted by China Unicom and China Telecom, respectively, offer faster network speeds and already enjoy wide acceptability in the marketplace. Additionally, TD-SCDMA also suffers from certain limitations when it comes to international roaming. These issues may restrict a wider adoption of China Mobile’s 3G network.
China Mobile aims to leverage the 4G TD-LTE opportunity to offset the limitations of the 3G TD-SCDMA network. Moreover, this move will also provide an opportunity to leapfrog the company’s Chinese peers to emerge as the first carrier to deploy 4G LTE based mobile broadband network in China, representing a significant competitive advantage.
LGNT가 WDM-PON을 집중 공략하고 있지만.
역시 World Wide 관점에서는 GPON이 강점을 구가하고 있습니다.
ATM과 같은 길을 WDM-PON이 걷지는 않을지 걱정이네요.
다음은 Huawei GPON 장비가 점점 강해지는 모습을 보여줍니다.
tradingmarkets 뉴스로 25일 올라온 기사입니다.
==========================================================================
Wed. November 25, 2009; Posted: 06:31 AM
BEIJING, Nov 25, 2009 (SinoCast Daily Business Beat via COMTEX) -- ERIC | Quote | Chart | News | PowerRating -- Chinese telecoms equipment provider Huawei Technologies Co., Ltd. saw its gigabyte passive optical networks (GPONs) have a interoperability (IOP) of 100%, after a worldwide testing activity in Beijing lately, according to insiders.
The GPON IPO testing was initiated by the Full Service Access Network Group (FSAN) and European Telecommunications Standards Institute (ETSI), luring 14 optical network terminal (ONT) manufactures, four chip makers, and five optical line terminal (OLT) providers like Telefonaktiebolaget LM Ericsson (NASDAQ: ERIC | Quote | Chart | News | PowerRating) and Motorola Inc. (NYSE: MOT).
The testing proved that the GPON equipment of Alcatel-Lucent (NYSE: ALU) also had an IOT of 100%, insiders said, adding that Ericsson's equipment gave wonderful performance, too. In addition, the GPON IOP testing is predicted to be carried out in other countries like France and the US.
Huawei achieved a 49% share of the GOPN FTTx solution market in Europe, Middle East, and Africa (EMEA) in 2008, becoming the biggest player in the local arena, according to the market adviser Infonetics Research.
Source: www.enet.com.cn (November 25, 2009)
2009년 11월 29일 - 대림절 제1주
성경 말씀
- 시편 25편
- 예레미야 33:14 ~ 18
- 데살로니가전서 3:11 ~ 13
- 누가복음 21:29 ~ 36
오늘의 주제
- 기다리는 마음
개인 상념
- 이범희 전도사님 진행이 괘안았다는.
- 오늘부터 블로그에 종교에 관한 상념을 적겠다고 시작했는데 잘 될지 걱정이라는
- 벌써 교회에 다닌지 1년하고 몇개월이 지나가는데 아직 마음의 정리가 잘 안된다는
- 오늘 주제는 별로 잘 다가오지 않는다는. 기다리는 것이 과연 무엇일까? 현실과의 괴리를 잊은채 또는 극복한채로 과연 생활을 어떻게 하는 것이 바람직한 것일지.
- 벌써 2009년이 거의 끝나가는 이 시점에 나는 뭔지..
현실에 충실할지 종교에 충실할지.. 과연 나의 모습은 무엇인지... 어렵네..
지난주에 드디어 2012를 보았다.
와우.. 그래픽은 빠빵.. 기대이상.
스토리.. 왕꽝. 기대이하.
연기.. 그런거 모르것고.
3시간동안 신나게 봤는데.
보고 난 후에 남는 것이 없네 그려.
전체적으로 스토리 및 개연성이 영 아니었던 현대판 노아의 방주 영화.
ㅋㅋㅋ
Ericsson이 Nortel의 North America 부분의 GSM부분을 인수했네요.
Nortel Wireless 부분은 Ericsson이 다 가져가는 군요. 에고 돈이 왠수입니다.
아래는 CNN money의 11월 25일자 기사입니다.
================================================================================
Ericsson (NASDAQ: ERIC) was today selected as successful bidder to acquire certain assets of the Carrier Networks division of Nortel relating to Nortel's GSM business in the US and Canada. The purchase is structured as an asset sale at a cash purchase price of USD 70 million on a cash and debt free basis, subject to adjustments. This announcement follows the completion of the auction process initiated by Nortel, and the transaction is subject to approval by courts in the US and Canada and customary regulatory approvals and other conditions.
Ericsson's bid for Nortel's GSM assets was made together with Kapsch CarrierCom AG of Austria. Under the agreements, Ericsson is acquiring certain assets of Nortel's GSM business in North America while Kapsch is paying USD 33 million to acquire most of the remaining assets outside North America.
Ericsson acquires an installed GSM base, which expands its North American footprint. The acquisition further strengthens Ericsson's ability to serve North America's leading wireless operators, which now benefit from the strength of the combined resources in an experienced and financially strong company.
"Along with our recent acquisition of Nortel's CDMA and LTE assets, the transaction emphasizes Ericsson's commitment to the North American market and strengthens our position as a leading provider of telecommunications technology and services in the United States and Canada" said Hans Vestberg, incoming President and CEO of Ericsson. "Our Ericsson family will be once again enriched by the addition of the valuable Nortel employees."
The agreement includes the transfer of important GSM business with North American operators such as AT&T and T-Mobile. Under the agreement Ericsson will offer employment to approximately 350 employees from Nortel. Nortel's North American GSM operations generated approximately USD 400 million in 2008.
Ericsson's North American business generated SEK 17.9 bn (USD 2.7 b) of sales in 2008, mainly from GSM and WCDMA equipment and associated services. Together with the recently announced acquisition of CDMA and LTE assets as well as the Sprint services agreement, the acquisition makes North America the largest geographical segment within Ericsson and encompasses some 14,500 employees, up from 5,000 at the beginning of 2009.
The acquired operations will contribute top- and bottom-line additions to Ericsson. The transaction is expected to have a positive effect on Ericsson's earnings within a year after closing.
Consummation of the transaction is subject to approval by the United States and Canadian Bankruptcy Courts and the satisfaction of regulatory and other conditions.
SEB Enskilda is acting as Ericsson's sole financial advisor in the transaction.
Notes to editors:
Picture of Hans Vestberg:
www.ericsson.com/ericsson/press/photos/management.shtml
Previously announced information on Ericsson's acquisitions of Nortel
assets:
www.ericsson.com/ericsson/press/releases/20090725-1330882.shtml
www.ericsson.com/ericsson/press/releases/20091113-1354893.shtml
www.youtube.com/ericssonpress#p/u/7/D3yDHV9O_5o
Ericsson's multimedia content is available at the broadcast room: www.ericsson.com/broadcast_room
Ericsson is the world's leading provider of technology and services to telecom operators. Ericsson is the leader in 2G, 3G and 4G mobile technologies, and provides support for networks with over 1 billion subscribers and has a leading position in managed services. The company's portfolio comprises of mobile and fixed network infrastructure, telecom services, software, broadband and multimedia solutions for operators, enterprises and the media industry. The Sony Ericsson and ST-Ericsson joint ventures provide consumers with feature-rich personal mobile devices.
Ericsson is advancing its vision "to be the prime driver in an all-communicating world" through innovation, technology, and sustainable business solutions. Working in 175 countries, more than 75,000 employees generated revenue of SEK 209 billion (USD 32.2 billion) in 2008. Founded in 1876 with the headquarters in Stockholm, Sweden, Ericsson is listed on OMX NASDAQ, Stockholm and NASDAQ New York.
www.ericsson.com
www.twitter.com/ericssonpress
FOR FURTHER INFORMATION, PLEASE CONTACT
Ericsson Corporate Public & Media Relations
Phone: +46 10 719 69 92
E-mail: media.relations@ericsson.com
Investors
Ericsson Investor Relations
Phone: +46 10 719 00 00
E-mail: investor.relations@ericsson.com
Ericsson Media Relations North America
Kathy Egan
Phone: +1 212-843-8422
E-mail: media.relations@ericsson.com
Ericsson discloses the information provided herein pursuant to the Securities Markets Act and/or the Financial Instruments Trading Act. The information was submitted for publication at on November 25, 2009 at 07.40 CET.
Press release PDF: http://hugin.info/1061/R/1357032/329989.pdf
This announcement was originally distributed by Hugin. The issuer is solely responsible for the content of this announcement.
Copyright © Hugin AS 2009. All rights reserved.
LG노텔의 노텔지분 매각이 이제 반환점을 넘어 끝으로 가고 있는 모습입니다.
진대제 아저씨가 ALU와 손잡고 뭔가 해볼려고 하는군요.
개인적으로는 LG노텔 회사를 위하여 Ericsson이 되었으면 하는 바램이고 LGE의 지분이 그대로 유지되길 바랍니다.
아래는 머니투데이 기사로서 11월 24일자 기사입니다.
===================================================================================
알카텔 루슨트(Alcatel-Lucent)와 스카이레이크 인큐베스트가 컨소시엄을 구성하면서 LG노텔 인수전이 3파전 양상으로 전개되고 있다.
알카텔과 스카이레이크는 최근 컨소시엄 구성에 관한 협약을 마무리하고 이달 말로 예정돼 있는 우선협상대상자 선정에 맞춰 관련준비 작업을 진행 중인 것으로 확인됐다.
업계에서는 세계 이동통신장비 시장에서 재도약을 노리고 있는 알카텔과 IT전문 사모펀드(PEF)를 표방하고 있는 스카이레이크의 결합에 의미를 부여하는 모습이다. 전략적투자자(SI)와 재무적투자자(FI)의 결합을 통해 시너지를 창출할 수 있다는 것.
문제는 자금이다. 현재 알카텔-스카이레이크 컨소시엄은 인수의향서(LOI) 제출 작업을 준비 중인 것으로 알려졌다. 내부 자금이 부족한 관계로 당장 투자확약서(LOC)를 제출하는 것은 무리라는 판단에서다.
반면 유력한 인수 후보 중 한 곳인 에릭슨(Ericsson)은 LOC 제출이 가능할 것으로 전망된다.
노텔 네트웍스의 CDMA 사업과 롱텀에볼루션(LTE) 기술을 인수하는데 소요된 비용 11억3000만달러를 제외하고도 16억5000만달러의 가용 현금성 자산을 보유하고 있어 상대적으로 인수 여력이 충분하다는 평가다.
업계 관계자는 "매각 주관사인 골드만삭스 입장에서는 LOI 보다는 LOC 수준의 제안서를 제출하는 후보에게 높은 점수를 줄 것"이라며 "에릭슨이 유리한 가운데 알카텔-스카이 컨소시엄과 원에쿼티파트너스(OEP)가 경쟁하는 구도"라고 말했다.
머니투데이 하진수 기자
Wall Street Journal의 오늘 기사입니다.
Nortel MEN 사업부를 Ciena가 인수하게 되었네요.
WSJ는 Ciena에 대한 사항보다는 NSN이 고배를 마셨다는 점에 주안점을 두는군요.
요즘 NSN이 말이 아니군요. 성장성에 의심받는 것도 그렇고. Nokia가 손뗀다는 소문도 있고.
===========================================================================================
STOCKHOLM (Dow Jones)--Network equipment vendor Nokia Siemens Networks said Monday it has lost the auction for Nortel Networks Corp's (NRTLQ) optical networking and carrier Ethernet assets to U.S.-based rival Ciena Corp (CIEN).
NSN, a joint venture between Finland's Nokia Corp. (NOK) and Germany's Siemens AG (SI), said the bankruptcy court-sanctioned auction started Friday and extended through the weekend.
"Nokia Siemens Networks believes that its final offer represented fair value for the assets, and further bidding could not be financially justified," the company said.
NSN press spokesperson Riitta Mard told Dow Jones Newswires that her company had bid for the Nortel assets to expand its presence within optical networking, adding that it is still looking for other acquisitions or partnerships as a way to grow its business.
She declined to comment on the size of NSN's final offer or Ciena's winning bid.
Last month, bankrupt Canadian equipment vendor Nortel said Ciena's cash and stock bid, then worth around $526 million, would be a stalking horse offer for its optical networking and carrier ethernet business, Reuters reported Saturday.
Analyst Greger Johansson at Redeye said Monday that the lost bid may hurt market sentiment to some extent as NSN now misses a growth opportunity, although the deal wasn't particularly large. Ciena might gain better synergies with Nortel's assets, so it made sense for NSN not to overpay for the business, he added.
Along with European peers, NSN has been pressured by falling capital expenditure among telecom operators and rising competition from Chinese rivals.
According to research firm Dell'Oro, Nokia Siemens' share of the global infrastructure market in revenue terms fell to 19.4% in the third quarter 2009 from 20% in the previous quarter as China-based Huawei Technologies Co. replaced it as the world's second largest equipment vendor after market leader L.M. Ericsson Telephone Co. (ERIC). Paris-based Alcatel-Lucent (ALU) is the fourth ranked global network company after NSN.
Most vendors have strived to reinforce their presence in North America, the world's largest telecom equipment market, in order to grow their business. Huawei told Dow Jones Newswires in a recent interview it aims to add 600 new employees in North America next year to support a rise in customer business.
Monday's announcement comes after NSN in July lost an auction for Nortel's Code Division Multiple Access and Long Term Evolution assets, which Swedish rival Ericsson bought for $1.13 billion, beating NSN's previous $650 million bid.
At 0854 GMT, Nokia shares in Helsinki traded up 0.8% at EUR9.03, against a 1.6% rise in the broader market.
Company Web site: www.nokiasiemensnetworks.com
-By Gustav Sandstrom, Dow Jones Newswires; +46-8-5451-3099; gustav.sandstrom@dowjones.com
11월 20일자로 신한금융투자에서 업종 리서치가 나왔다.
방대한 분량으로 이거 올라갈란가 모르겟고.
퍼올려도 될래나 걱정도 되지만.
나름 괘안은 정보같아 업로드해 본다.
2개의 PDF를 여러개의 ZIP으로 분리해 올려놓을 것인데.
잘 되어야 될텐데. ㅎㅎㅎ
7zip으로 5개로 분리해 올린거니깐 알아서 풀어서 쓰시길.
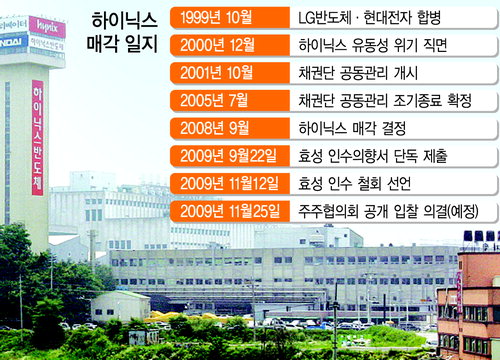
하이닉스가 효성과의 M&A가 물건너간 이후에 LG를 바라보고 있단다.
들리던 이야기에 의하면 일전에 LG가 하이닉스 M&A TF를 만든적도 있다던데.
워낙 지난 현대반도체와 LG반도체의 합병 타격이 커서 더러워서 안한다는 감정이 있다는.
그나저나 다시 가져오는 것이 실효가 있을까?
실제 메모리쪽이 있는 것이 통신쪽에도 도움이 많이 되기는 허는데 말이다.
흡흡...
아무튼 22일자 경향신문에 모처럼 자세한 사항이 나온 기사가 실렸다.
==================================================================================
경향신문 | 전병역기자 | 입력 2009.11.22 18:04
효성의 인수 포기로 '반도체 공룡' 하이닉스는 다시 무주공산이 됐다.
하이닉스 주주협의회는 25일 회의를 갖고 공개 재매각을 결정한다. 그러나 하이닉스의 '덩치'나 매년 수조원의 투자 규모를 감안하면 새 주인을 찾기가 그리 쉽지않다. 그렇다고 수출 효자인 세계 2대 반도체 회사를 해외에 매각하는 것은 상상키 어렵다. 자연스럽게 재계의 시선은 다시 LG 구본무 회장에게 쏠려 있다.
LG가 하이닉스 최적격 인수 회사라는 데 이의를 다는 사람은 없다.
무엇보다 LG반도체를 운영하며 하이닉스 내부 사정을 가장 잘 안다. LG는 1989년 금성반도체를 설립하며 반도체 사업을 시작했다. 이듬해 1000억원의 매출을 올린 뒤 LG반도체로 이름을 바꾼 95년에는 무려 35배가 넘는 2조5000억원의 매출 실적을 올렸다. 정보처리 속도가 빠른 램버스 D램 분야에서는 아직도 세계 최초 개발 기업이라는 상징성을 갖고 있다. 액정화면(LCD)이나 휴대전화 사업을 갖고 있어 반도체와는 뗄레야 뗄 수 없는 사업구조를 갖고 있는 점도 그렇다. 무엇보다 신규 생산라인 신·증설에 3조원 안팎의 투자 여력을 갖고 있어야 하는 하이닉스 인수업체의 첫 번째 자격 요건을 감안하면 더욱 그렇다.
그러나 정작 구 회장은 하이닉스 얘기만 나오면 손사래를 친다.
구 회장과 하이닉스의 '악연'은 99년으로 거슬러 올라간다. 이른바 '빅딜'로 불리는 정부 주도의 사업 구조조정 작업이 한창일 무렵이다. 당시 LG반도체와 현대전자의 합병 논의가 최대 이슈였다. 구 회장은 LG반도체를 현대전자와 합병하는 데 반대했다. 그룹의 모든 역량을 동원해 반도체 빅딜을 무산시키려는 확고한 의지를 갖고 있었다.
구 회장은 99년 1월 청와대에서 김대중 전 대통령과 독대한 뒤 반도체 사업을 접기로 했다. 당시 반도체 통합 '무용론'을 설명하러 두둑한 서류뭉치를 들고 갔지만 김 전 대통령의 확고한 의지를 확인하고는 서류를 꺼내지도 못했다고 한다. 청와대를 나온 구 회장은 한동안 술과 눈물로 반도체 잃은 설움을 달랬다는 유명한 일화가 있다.
당시 양사의 반도체 빅딜을 주선한 전국경제인엽합회에 이후 일절 발걸음조차 하지 않고 있는 것도 비슷한 맥락이다. 그만큼 구 회장의 분노와 섭섭함이 컸던 셈이다.
구 회장은 하이닉스 매각 과정에 LG 이름이 오르내릴 때마다 "반도체 얘기는 꺼내지도 말라"고 말해 왔다.
LG그룹 측도 "하이닉스에는 아무 관심이 없다"며 매번 같은 레퍼토리를 반복하고 있다.
하지만 구 회장은 반도체를 완전히 포기하지는 않았다.
일반인에게는 잘 알려져 있지 않지만 LG전자는 지금도 세계적인 수준의 반도체 설계 능력을 갖고 있다. 비록 생산 설비는 하이닉스에 넘겼지만 핵심 설계 인력은 그대로 LG전자에 잔류시켰다. 구 회장이 하이닉스에 별 다른 흥미를 느끼지 않고 있는 배경엔 이 같은 이유도 한 몫을 하고 있다.
LG 관계자는 "반도체를 설계한 뒤 삼성전자나 하이닉스, 대만·일본 업체에 위탁 생산하면 된다"면서 "굳이 막대한 투자비를 들여가며 반도체 회사를 갖고 있을 이유가 없다"고 말했다.
또 하이닉스는 LG 외엔 대안이 없기 때문에 시간이 흐를수록 값어치는 떨어질 수밖에 없다. LG로서는 굳이 서두를 필요도 없다. 효성처럼 특혜 의혹이라는 누명을 써가며 나설 이유가 없는 셈이다.
이런 와중에 그룹 덩치나 위상에 비해 내수기업 이미지를 벗지 못한 SK나 롯데, 현대중공업의 향후 행보도 관심거리다. 이들 그룹은 그러나 "하이닉스를 인수할 계획이 없다"고 밝혔다.
< 전병역기자 junby@kyunghyang.com >

W hotel seoul.
가보고 싶다고 벼르고 있는 곳임

홈피에서 예약하면 현재 50% DC중인가보다. 흐미
Fabulous room 모습

Woobar의 모습
요즘 저탄소 녹색성장에 대한 말이 많다.
따라서 태양광에 대한 연구도 주목을 받고 있다.
아래 첨부파일은 지난 11월 중순 엘지경제연구소에서 내놓은 의견이다.
결국 보다 체계적인 전략이 필요하다는 이야기이다.
개인적인 생각으로는 현재 나타나고있는 이러한 노력은 세계 경제의 활로를 못찾고 있는 상태에서 나온 굴욕적 테마라고 생각한다.
이제 성장성이 아닌 효율성을 중시하는 산업 체제로 나아간다는 이야기인데
이는 전체적 산업 성장의 정체가 시작되었다는 반증이다.
이 난국을 무엇으로 타개해야할까?
참 난제이다. 이런 효율성을 중시하는 대세에 참여하여야 하는 것인가?
ZDNET KOREA에 지난 11월 18일에 나온 기사입니다.
통신 장비쪽에 중국 기업이 2위로 부상하고있죠.
LCD 시장도 이젠 중국 업체의 부상이 감지되나봅니다.
슬기롭게 헤쳐가야 될텐데 어찌될지..
============================================================================
TCL,팹 설립선언‧‧‧中 TV업계 가세움직임
중국‧대만 전자업계가 잇따라 세계 LCD TV시장을 내다본 거보를 내디디며 세계 LCD시장에 ‘차이완(차이나+타이완)쇼크’를 예고했다.
지난 주 혼하이정밀 계열의 이노룩스가 세계 4위 LCD업체인 대만의 치메이를 인수한데 이어 17일에는 중국 최대 TV메이커인 TCL이 LCD팹 설립한다고 발표했다.
이같은 분위기 속에 3년전 LCD생산을 모색했던 중국TV업체들의 움직임도 주목거리다.
파이낸셜타임스(FT)는 17일(현지시간) 중국의 최대 전자그룹의 하나인 TCL이 선전시 당국과 새로운 LCD공장설립을 위해 셴차오인베스트먼트와 조인트벤처를 만들었다고 보도했다.
|
FT는 특히 그동안 LCD시장진입의 장벽으로 지적돼 왔던 LCD기술확보와 관련, 최근 이노룩스에 인수된 치메이기술자들의 TCL유입 가능성에 주목했다.
보도는 이같은 움직임의 증거로 “TCL이 첸리 비 전 치메이 부사장을 LCD사업부의 고위직으로 영입한 것으로 믿어진다”며 고 이름까지 밝혔다.
지난주 이노룩스가 세계 4위의 LCD업체인 치메이를 인수한데 따라 더많은 기술경력자들이 중국으로 옮아갈 수 있음을 예상케 하는 대목이다.
FT는 TCL의 발표가 이 중국회사들의 LCD참여 러시를 가속할 포문을 열었다고 보도했다.
대만 산업분석회사 위츠뷰의 헨리 왕 부장은 "창홍,스카이워스,하이어 등 다른 중국 TV제조업체들 또한 LCD패널 생산을 검토하고 있는데 아마도 기존 중국 패널제조업체의 주식을 인수하는 방식이 될 것"이라고 전망했다.
이번 중국 TCL의 LCD패널생산 계획 발표는 삼성,LG,샤프 등 세계 LCD패널제조 메이저가 중국의 평판TV시장 성장에 따른 시장확보를 위해 중국에 패널제조공장을 설립하겠다는 발표에 이어 나온 것이다.
|
중국의 LCD패널 생산참여 러시는 지방정부들이 새로운 일자리를 만들고 땅값을 올리기 위해 유명한 첨단기술프로젝트를 자기고장으로 끌어들이기 시작하면서 시작됐다.
그러나 애널리스트들은 중국의 전자부품제조업 진입은 자본 기술집약적인 LCD패널제조 특성상 일부 업체들에게는 심각한 도전이 될 것이라고 말했다.
헨리 왕 부장은 “LCD패널 사업은 새로운 팹에 들어가는 비용이 가파르게 상승하고 있고 중국은 여기에 투자할 돈이 없다”고 말했다.
티엘아이가 M&A가 무산된 지금 성장성에 대한 의심을 받고 있습니다.
하지만 LG그룹의 전략적 제휴 회사인만큼 슬기롭게 극복하리라 생각합니다.
다음 PDF는 11월 중순 메리츠 증권에서 리서치한 자료입니다.
LG POP GD510이 11월 초순부터 영국 시장에 런치했습니다.
잘 되었으면 좋겠네요. 가지고싶은 마음도 있습니다.
아래는 10월에 국내 신문에 게재된 내용입니다.
ZDNET KOREA에서 퍼왔습니다.
=================================================================================
LG전자(대표 남용)가 3인치 풀터치폰 중 세계 최소 크기의 '팝(LG GD510)'을 영국 등 유럽 15개 국가에 출시했다고 14일 발표했다.
'팝'은 '쿠키폰'의 후속으로 디자인과 기능을 업그레이드했다.
쿠키폰과 동일한 3인치 LCD를 채용하면서도 '내로우 베젤' 기술을 적용해 화면 좌우 테두리 두께를 각각 3mm 가량 줄였다. 이를 통해 쿠키폰보다 면적을 20% 가까이 줄여 한 손에 쏙 들어오는 크기(97.8×49.5×11.2mm)로 재탄생했다. 내로우 베젤은 최근 LCD TV에 사용되고 있는 첨단 기술로 디스플레이 주위의 테두리 두께를 줄이는 기술이다.
|
핵심 멀티미디어 기능도 강화했다. '팝'은 플래시로 구현되는 사용자환경(UI)을 통해 보다 쉽고 빠르게 메뉴와 위젯 등을 사용할 수 있으며, 300만 화소 카메라로 생생한 사진과 동영상을 찍을 수 있다.
이밖에 8GB까지 확장 가능한 외장 메모리 슬롯, 블루투스, MP3 플레이어, FM 라디오 등 다양한 부가 기능을 갖췄다.
'팝(Pop)'이란 애칭은 누구나 쉽게 접하고 좋아한다는 의미의 'Popular'에서 따왔다.
한편, LG전자는 태양광 충전이 가능한 '팝' 전용 휴대폰 배터리 팩을 별도 출시했다. 태양광 배터리 커버로 갈아 끼우고 태양 아래서 10분 충전 시 2분 15초간 통화가 가능하다.
안승권 LG전자 MC사업본부 사장은 "팝은 지금까지 전 세계 750만대 이상 팔린 쿠키폰의 신화를 이어갈 제품"이라며 "시장을 선도하는 LG전자의 터치 기술력을 바탕으로 다양한 눈높이의 소비자를 만족시킬 것"이라고 말했다.
Nortel이 3Q 실적을 발표했습니다.
LG-Nortel의 실적도 많이 감소했습니다.
본 기사는 11월 16일자 CNN-Money 기사입니다.
==================================================================================
Nortel Networks Corporation (OTCBB: NRTLQ) -
Financial Presentation
- EMEA subsidiaries, and entities they control (Equity Investees), are presented using the equity method of accounting
-- financial position and results of operations of the Equity Investees presented net on a single line in the balance sheet and statement of operations, respectively, versus being combined gross into each individual line item
- ES, NGS, and DiamondWare businesses presented as discontinued operations
- Results for three and nine months ended September 30, 2008 have not been recast to reflect the equity method of accounting but have been recast to reflect the presentation of discontinued operations. As a result, comparative periods may not provide meaningful analysis
- CDMA business reported as continuing operations, as did not qualify for presentation as discontinued operations
Financial Results
- Third quarter consolidated Revenues of $1.05 billion, which excludes third quarter revenues of $348 million related to Equity Investees and $353 million related to discontinued operations
- Third quarter SG&A and R&D expenses of $339 million
-- Excludes expenses of $166 million related to Equity Investees
-- Includes $52 million related to workforce and other cost reduction activities and pension curtailment losses that historically would have been recorded in special charges
- Consolidated cash balance as of September 30, 2009 was $1.81 billion and excluded Equity Investees cash of $798 million. The cash balance reported as of June 30, 2009 was $2.56 billion and included Equity Investees cash of $819 million
- Customer service levels remain strong
- Focus is on maximizing value for stakeholders, including creditors, customers and employees
Nortel(1) Networks Corporation (OTCBB: NRTLQ) announced its results for the third quarter 2009. Results were prepared in accordance with United States generally accepted accounting principles (GAAP) in U.S. dollars.
Following discussions with the U.S. Securities and Exchange Commission (SEC), commencing with the quarterly report on Form 10-Q for the quarter ended September 30, 2009, Nortel will no longer combine the results of the Europe, Middle East and Africa (EMEA) subsidiaries, and entities they control (Equity Investees), with its consolidated results. Nortel has determined that, as of the Petition Date, it is appropriate to present its Equity Investees under the equity method of accounting based on the conclusion that Nortel exercises significant influence over those entities. The equity method of accounting results in the financial position and results of operations of the Equity Investees being presented net on a single line in the balance sheet and statement of operations, respectively, versus being combined gross into each individual line item. The comparative periods have not been recast for this change in presentation. As a result, analysis using the comparative periods may be difficult and may not provide meaningful comparisons.
The Enterprise Solutions (ES) business as well as the Nortel Government Solutions (NGS) and DiamondWare businesses are presented as discontinued operations for the quarter ended September 30, 2009. Accordingly, comparative periods have been recast to give effect for the change in presentation.
The CDMA business did not qualify for treatment as discontinued operations and as a result has been included in continuing operations.
Except in the Segment Revenues section, the discussion below relates to Results from Continuing Operations under U.S. GAAP and excludes the financial results of the Equity Investees.
Consistent with the way we manage our business segments, the financial information in the Segment Revenues section includes the results of the Equity Investees within each segment. Therefore, in order to reconcile the financial information for the business segments discussed below to our consolidated financial information, the net financial results of the Equity Investee must be removed.
Third Quarter 2009 Financial Summary
Nortel's overall financial performance in the third quarter of 2009 continued to be impacted by ongoing negative economic conditions and the uncertainty created by the Company's Creditor Protection Proceedings, which resulted in a decrease in customers' spending levels.
- Revenues in the third quarter of $1,045 million, with declines year over year in all segments, except Carrier VoIP and Application Solutions (CVAS), and in all regions. These revenues exclude third quarter revenues related to Equity Investees' revenues of $348 million and $353 million related to discontinued operations. We previously reported total revenues of $2,319 million in the third quarter of 2008.
- Gross margin of 45 percent in the quarter, an increase of 6.8 percentage points from the year ago quarter, includes charges related to workforce and other cost reduction activities and pension curtailment losses that historically would have been recorded in special charges. Excluding these charges, gross margin in the third quarter of 2009 would have been 47 percent (a). Gross margin was positively impacted by the exclusion of the Equity Investees.
- SG&A expense in the third quarter of $155 million, a decrease of 43 percent from the year ago quarter. Excluding $32 million related to workforce and other cost reduction activities and pension curtailment losses that historically would have been recorded in special charges, SG&A for the third quarter of 2009 would have decreased by 55 percent year over year (a). SG&A expense in the third quarter excludes $129 million related to Equity Investees
- R&D expense in the third quarter of $184 million, a decrease of 32 percent from the year ago quarter. Excluding $20 million related to workforce and other cost reduction activities and pension curtailment losses that historically would have been recorded in special charges, R&D expense for the third quarter of 2009 would have decreased by 39 percent year over year (a). R&D expense in the third quarter excludes $37 million related to Equity Investees
- Cash balance as of September 30, 2009 was $1.81 billion and excluded Equity Investees cash of $798 million. The consolidated cash balance plus Equity Investees cash exceeded the June 30, 2009 consolidated cash balance of $2.56 billion, which included Equity Investees cash of $819 million.
Segment Revenues
The financial information for our business segments includes the results of the Equity Investees as if they were consolidated, which is consistent with the way we manage our business segments, but does not include the results of discontinued operations. Commencing with the third quarter of 2009, Nortel is reporting its CVAS business unit as a separate reportable segment. Prior to that time, the results of CVAS were included in the Wireless Networks (WN) reportable segment, which prior to the third quarter of 2009 was called the Carrier Networks (CN) reportable segment.
Segment revenues were $1,271 million for the third quarter of 2009 compared to $1,595 million for the third quarter of 2008, reflecting a reduction of 20% percent due to declines across all business segments, except CVAS. The reduction was primarily a result of the continuing economic downturn and the uncertainty created by the Creditor Protection Proceedings.
                        Segment Revenues B/(W)
----------------------------------------------------------------------
----------------------------------------------------------------------
                                          Q3 2009    Q3 2008     YoY
----------------------------------------------------------------------
Wireless Networks                         $   663    $   805     (18%)
Carrier VoIP and Application Solutions    $   208    $   182      14%
Metro Ethernet Networks                   $   295    $   398     (26%)
LGN                                       $   103    $   211     (51%)
Other                                     $     2    $    (1)    150%
----------------------------------------------------------------------
 Total Segment Revenues                   $ 1,271    $ 1,595     (20%)
----------------------------------------------------------------------
----------------------------------------------------------------------
Discontinued Operations (i)               $   475    $   724     (34%)
----------------------------------------------------------------------
----------------------------------------------------------------------
(i) Includes revenues related to Equity Investees
WN revenues in the third quarter of 2009 were $663 million, a decrease of 18% percent compared with the year ago quarter with declines in the GSM and UMTS solutions business, while the CDMA solutions business was essentially flat. The wireless segment was negatively impacted by a reduction in spending by certain customers as a result of their change in technology migration plans.
CVAS revenues in the third quarter of 2009 were $208 million, an increase of 14% percent compared with the year ago quarter due to contract deliveries and project completions in the third quarter of 2009.
Metro Ethernet Networks (MEN) revenues in the third quarter of 2009 were $295 million, a decrease of 26% percent compared with the year ago quarter with impacts across all businesses. In addition to the factors above, lower revenues from certain customers also impacted the year over year decline.
LG-Nortel Co. Ltd. (LGN) revenues in the third quarter of 2009 were $103 million, a decrease of 51% percent compared with the year ago quarter. In addition to the factors described above, a majority of the decline was in LGN Carrier, primarily due to the recognition of certain deferred revenues in the third quarter of 2008 not repeated in the third quarter of 2009 and higher sales volumes related to our 3G wireless products in the third quarter of 2008, as well as the impact of foreign exchange fluctuations. The decrease was partially offset by network upgrades related to certain customers and an increase in wireless local loop sales in the third quarter of 2009.
Discontinued operations revenues in the third quarter of 2009 were $475 million, a decrease of 34% percent compared with the year ago quarter. In addition to the factors above, Asia and Canada revenues were also unfavorably impacted by foreign exchange fluctuations.
Gross Margin
Gross margin was 45.0 percent of revenues in the third quarter of 2009. Excluding charges related to workforce and other cost reduction activities and pension curtailment losses that historically would have been recorded in special charges, gross margin in the third quarter of 2009 would have been 47 percent (a) of revenues. This compared to gross margin of 38.2 percent for the third quarter of 2008. Compared to the third quarter of 2008, in addition to the items already noted, gross margin increased primarily as a result of the exclusion of the Equity Investees, which positively impacted gross margin by 5.7 percentage points, the favorable impacts of product mix and the favorable impact of foreign exchange fluctuations and price erosion, and a decrease in warranty costs.
Operating Expenses
Operating Expenses B/(W)
------------------------------------------------------------
------------------------------------------------------------
                                          Q3 2009       YoY
------------------------------------------------------------
 SG&A                                     $   155      (43%)
 R&D                                      $   184      (32%)
------------------------------------------------------------
Total Operating Expenses                  $   339      (37%)
------------------------------------------------------------
------------------------------------------------------------
A focus on reducing costs resulted in lower operating expenses compared to the year ago quarter. Operating expenses were $339 million in the third quarter of 2009. This compares to operating expenses of $541 million for the third quarter of 2008.
SG&A expenses were $155 million in the third quarter of 2009, compared to $272 million for the third quarter of 2008. Excluding charges related to workforce and other cost reduction activities and pension curtailment losses that historically would have been recorded in special charges, SG&A expenses for the third quarter of 2009 would have been $123 million (a). SG&A expense in the third quarter of 2009 also excludes $129 million related to Equity Investees. Compared to the third quarter of 2008, in addition to the items already noted, SG&A was favorably impacted primarily by headcount reductions and lower spending levels across all categories including a reduction in sales and marketing investment in maturing technologies.
R&D expenses were $184 million in the third quarter of 2009, compared to $269 million for the third quarter of 2008. Excluding charges related to workforce and other cost reduction activities and pension curtailment losses that historically would have been recorded in special charges, R&D expenses for the third quarter of 2009 would have been $164 million (a). R&D expense in the third quarter of 2009 also excludes $37 million related to Equity Investees. Compared to the third quarter of 2008, in addition to the items already noted, R&D was favorably impacted primarily by headcount reductions and the cancellation of certain R&D programs.
Net Loss
The Company reported a net loss in the third quarter of 2009 of $508 million compared to net loss of $3,413 million in the third quarter of 2008.
The net loss in the third quarter of 2009 of $508 million included a loss from discontinued operations of $164 million, reorganization costs of $223 million primarily related to the recording of a pension liability, interest expense of $75 million, other charges of $46 million, comprised in part by pension curtailment expense and break-up fees in relation to the CDMA and LTE Access Asset sale, $10 million in income tax expense and an expense of $3 million for earnings attributable to non-controlling interests (formerly minority interests), partially offset by Other income -- net of $60 million, comprised in part of a currency exchange gains of $61 million.
The net loss in the third quarter of 2008 of $3,413 million included $2,133 million in income tax expense, a goodwill impairment charge of $661, loss from discontinued operations of $556, interest expense of $81 million, special charges of $41 million for headcount and other cost reduction activities, an expense of $21 million for earnings attributable to non-controlling interests (formerly minority interests) and Other expense- net of $14 million, comprised primarily of a gain of $8 million due to changes in foreign exchange rates and a loss of $4 million from mark-to-market gains on interest rate swaps.
Cash
Consolidated cash balance as of September 30, 2009 was $1.81 billion and excluded Equity Investees cash of $798 million. The consolidated cash balance plus Equity Investees cash exceeded the June 30, 2009 consolidated cash balance of $2.56 billion, which included Equity Investees cash of $819 million. The decrease in the consolidated cash balance was primarily due to the deconsolidation of the Equity Investees, cash used in investing activities of $50 million, mainly due to changes in restricted cash and cash used in financing activities of $2 million, partially offset by cash from operating activities of $124 million and net favorable foreign exchange impacts of $41 million.
(a) Each of Gross Margin, SG&A Expense and R&D Expense, excluding the impact of charges in relation to headcount and other cost reduction activities and pension curtailment losses that historically would have been recorded in special charges, are non-GAAP measures. Nortel's management believes that these measures are meaningful measurements of operating performance and provides greater transparency to investors with respect to Nortel's performance and supplemental information used by management in its financial and operational decision making. These non-GAAP measures may also facilitate comparisons to Nortel's historical performance and competitors' operating results. These non-GAAP measures should be considered in addition to, but not as a substitute for, the information contained in Nortel's financial statements prepared in accordance with GAAP. These measures may not be synonymous to similar measurement terms used by other companies.
About Nortel
For more information, visit Nortel on the Web at www.nortel.com. For the latest Nortel news, visit www.nortel.com/news.
Certain statements in this press release may contain words such as "could", "expects", "may", "should", "will", "anticipates", "believes", "intends", "estimates", "targets", "plans", "envisions", "seeks" and other similar language and are considered forward-looking statements or information under applicable securities laws. These statements are based on Nortel's current expectations, estimates, forecasts and projections about the operating environment, economies and markets in which Nortel operates. These statements are subject to important assumptions, risks and uncertainties that are difficult to predict, and the actual outcome may be materially different. Nortel's assumptions, although considered reasonable by Nortel at the date of this report, may prove to be inaccurate and consequently Nortel's actual results could differ materially from the expectations set out herein.
Actual results or events could differ materially from those contemplated in forward-looking statements as a result of the following: (i) risks and uncertainties relating to the Creditor Protection Proceedings including: (a) risks associated with Nortel's ability to: stabilize the business and maximize the value of Nortel's businesses; obtain required approvals and successfully consummate pending and future divestitures; ability to satisfy transition services agreement obligations in connection with divestiture of operations; successfully conclude ongoing discussions for the sale of Nortel's other assets or businesses; develop, obtain required approvals for, and implement a court approved plan; resolve ongoing issues with creditors and other third parties whose interests may differ from Nortel's; generate cash from operations and maintain adequate cash on hand in each of its jurisdictions to fund operations within the jurisdiction during the Creditor Protection Proceedings; access the EDC Facility given the current discretionary nature of the facility, or arrange for alternative funding; if necessary, arrange for sufficient debtor-in-possession or other financing; continue to have cash management arrangements and obtain any further required approvals from the Canadian Monitor, the U.K. Administrators, the French Administrator, the Israeli Administrators, the U.S. Creditors' Committee, or other third parties; raise capital to satisfy claims, including Nortel's ability to sell assets to satisfy claims against Nortel; maintain R&D investments; realize full or fair value for any assets or business that are divested; utilize net operating loss carryforwards and certain other tax attributes in the future; avoid the substantive consolidation of NNI's assets and liabilities with those of one or more other U.S. Debtors; attract and retain customers or avoid reduction in, or delay or suspension of, customer orders as a result of the uncertainty caused by the Creditor Protection Proceedings; maintain market share, as competitors move to capitalize on customer concerns; operate Nortel's business effectively in consultation with the Canadian Monitor, and the U.S. Creditors' Committee and work effectively with the U.K. Administrators, French Administrator and Israeli Administrators in their respective administration of the EMEA businesses subject to the Creditor Protection Proceedings;
continue as a going concern; actively and adequately communicate on and respond to events, media and rumors associated with the Creditor Protection Proceedings that could adversely affect Nortel's relationships with customers, suppliers, partners and employees; retain and incentivize key employees and attract new employees as may be needed; retain, or if necessary, replace major suppliers on acceptable terms and avoid disruptions in Nortel's supply chain; maintain current relationships with reseller partners, joint venture partners and strategic alliance partners; obtain court orders or approvals with respect to motions filed from time to time; resolve claims made against Nortel in connection with the Creditor Protection Proceedings for amounts not exceeding Nortel's recorded liabilities subject to compromise; prevent third parties from obtaining court orders or approvals that are contrary to Nortel's interests; reject, repudiate or terminate contracts; and (b) risks and uncertainties associated with: limitations on actions against any Debtor during the Creditor Protection Proceedings; the values, if any, that will be prescribed pursuant to any court approved plan to outstanding Nortel securities and, in particular, that Nortel does not expect that any value will be prescribed to the NNC common shares or the NNL preferred shares in any such plan; the delisting of NNC common shares from the NYSE; and the delisting of NNC common shares and NNL preferred shares from the TSX; and (ii) risks and uncertainties relating to Nortel's business including: the sustained economic downturn and volatile market conditions and resulting negative impact on Nortel's business, results of operations and financial position and its ability to accurately forecast its results and cash position; cautious capital spending by customers as a result of factors including current economic uncertainties; fluctuations in foreign currency exchange rates;
any requirement to make larger contributions to defined benefit plans in the future; a high level of debt, arduous or restrictive terms and conditions related to accessing certain sources of funding; the sufficiency of workforce and cost reduction initiatives; any negative developments associated with Nortel's suppliers and contract manufacturers including Nortel's reliance on certain suppliers for key optical networking solutions components and on one supplier for most of its manufacturing and design functions; potential penalties, damages or cancelled customer contracts from failure to meet contractual obligations including delivery and installation deadlines and any defects or errors in Nortel's current or planned products; significant competition, competitive pricing practices, industry consolidation, rapidly changing technologies, evolving industry standards, frequent new product introductions and short product life cycles, and other trends and industry characteristics affecting the telecommunications industry; any material, adverse affects on Nortel's performance if its expectations regarding market demand for particular products prove to be wrong; potential higher operational and financial risks associated with Nortel's international operations; a failure to protect Nortel's intellectual property rights; any adverse legal judgments, fines, penalties or settlements related to any significant pending or future litigation actions; failure to maintain integrity of Nortel's information systems; changes in regulation of the Internet or other regulatory changes; and Nortel's potential inability to maintain an effective risk management strategy.
For additional information with respect to certain of these and other factors, see Nortel's Annual Report on Form 10-K, Quarterly Reports on Form 10-Q and other securities filings with the SEC. Unless otherwise required by applicable securities laws, Nortel disclaims any intention or obligation to update or revise any forward-looking statements, whether as a result of new information, future events or otherwise.
(1)Nortel, the Nortel logo and the Globemark are trademarks of Nortel Networks.
Note that Nortel will not be hosting a teleconference/audio webcast to discuss third quarter 2009 results.
NORTEL NETWORKS CORPORATION
(Under Creditor Protection Proceedings as of January 14, 2009)
Condensed Consolidated Statements of Operations (unaudited)
(U.S. GAAP; Millions of U.S. dollars, except per share amounts)
Three months ended Nine months ended
--------------------------- --------------------------
September 30, September 30, September 30, September 30,
2009 2008 2009 2008
--------------------------- --------------------------
Revenues:
Products $ 962 $ 1,443 $ 3,060 $ 5,113
Services 83 152 234 439
--------------------------- --------------------------
1,045 1,595 3,294 5,552
--------------------------- --------------------------
Cost of revenues
Products 548 923 1,785 3,067
Services 27 62 81 175
--------------------------- --------------------------
575 985 1,866 3,242
--------------------------- --------------------------
Gross profit 470 610 1,428 2,310
45.0% 38.2% 43.4% 41.6%
Selling, general
and administrative
expense 155 272 540 919
Research and
development expense 184 269 608 905
Management
operating margin 131 69 280 486
12.5% 4.3% 8.5% 8.8%
Amortization of
intangible assets 3 (7) 9 16
Goodwill impairment - 661 - 661
Special charges - 41 - 166
Loss (gain) on sale
of businesses and
sales and
impairments of assets 15 (6) (1) (10)
Other operating
expense - net 46 15 46 33
--------------------------- --------------------------
Total operating
expenses 403 1,245 1,202 2,690
--------------------------- --------------------------
Operating earnings
(loss) 67 (635) 226 (380)
Other income
(expense) - net 60 (14) 13 (11)
Interest and
dividend income - 27 - 95
Interest expense
Long-term debt (75) (78) (224) (225)
Other - (3) (1) (12)
--------------------------- --------------------------
Earnings (loss)
from continuing
operations before
reorganization
items,
incomes taxes, and
equity in net
earnings of
associated companies
and Equity Investees 52 (703) 14 (533)
Reorganization
items - net (223) - (284) -
--------------------------- --------------------------
Loss from continuing
operations before
incomes taxes and
equity in net
earnings of
associated
companies and
Equity Investees (171) (703) (270) (533)
Income tax expense (10) (2,133) (47) (2,234)
--------------------------- --------------------------
Loss from continuing
operations before
equity in net
earnings of
associated
companies and
Equity Investees (181) (2,836) (317) (2,767)
Equity in net
earnings
of associated
companies -
net of tax (1) - (1) 2
Equity in net
loss of Equity
Investees (a) (159) - (448) -
--------------------------- --------------------------
Net loss from
continuing
operations (341) (2,836) (766) (2,765)
Net loss from
discontinued
operations -
net of tax (b) (164) (556) (488) (745)
--------------------------- --------------------------
Net loss (505) (3,392) (1,254) (3,510)
Income attributable
to noncontrolling
interests (3) (21) (35) (154)
--------------------------- --------------------------
Net loss
attributable
to Nortel Networks
Corporation $ (508) $ (3,413) $ (1,289) $ (3,664)
--------------------------- --------------------------
--------------------------- --------------------------
Average shares
outstanding
(millions)
- Basic 499 498 499 498
Average shares
outstanding
(millions)
- Diluted 499 498 499 498
--------------------------- --------------------------
Basic and diluted
loss per common
share
- continuing
operations ($0.69) ($5.73) ($1.61) ($5.86)
--------------------------- --------------------------
--------------------------- --------------------------
Basic and diluted
loss per common
share
- discontinued
operations ($0.33) ($1.12) ($0.98) ($1.50)
--------------------------- --------------------------
--------------------------- --------------------------
Total basic and
diluted loss per
common share ($1.02) ($6.85) ($2.59) ($7.36)
--------------------------- --------------------------
--------------------------- --------------------------
(a) Nortel has determined that, as of the Petition Date, the
presentation of the Equity Investees under the equity method of
accounting was more appropriate based on the conclusion that Nortel
exercises significant influence over those entities. The equity method
of accounting will result in the financial position and results of
operations of the Equity Investees being presented net on a single line
in the balance sheet and statement of operations, respectively, versus
being combined gross into each individual line item.
The comparative periods have not been recast for the change in
accounting. As a result, meaningful analysis to the comparative periods
may be difficult.
(b) The ES business as well as the shares of NGS and DiamondWare are
presented as discontinued operations for the quarter ended September
30, 2009. Accordingly, comparative periods have been recast to give
effect for the change in presentation.
NORTEL NETWORKS CORPORATION
(Under Creditor Protection Proceedings as of January 14, 2009)
Condensed Consolidated Balance Sheets (unaudited)
(U.S. GAAP; Millions of U.S. dollars, except per share amounts)
-------------------------------------
September 30, 2009 December 31, 2008
--------------------------------------------------------------------------
ASSETS
Current assets
Cash and cash equivalents $ 1,818 $ 2,397
Short-term investments 6 65
Restricted cash and cash equivalents 118 36
Accounts receivable - net 901 2,154
Inventories - net 350 1,477
Deferred income taxes - net 12 44
Other current assets 373 455
Assets held for sale 208 -
Assets of discontinued operations (a) 727 -
--------------- --------------
Total current assets 4,513 6,628
Investments 139 127
Plant and equipment - net 786 1,272
Goodwill 10 180
Intangible assets - net 54 143
Deferred income taxes - net 13 12
Other assets 190 475
--------------- --------------
Total assets $ 5,705 $ 8,837
--------------- --------------
--------------- --------------
LIABILITIES AND SHAREHOLDERS' DEFICIT
Current liabilities
Trade and other accounts payable $ 300 $ 1,001
Payroll and benefit-related liabilities 167 453
Contractual liabilities 96 213
Restructuring liabilities 9 146
Other accrued liabilities 743 2,674
Long-term debt due within one year - 19
Liabilities held for sale 398 -
Liabilities of discontinued
operations (a) 613 -
--------------- --------------
Total current liabilities 2,326 4,506
Long-term liabilities
Long-term debt 41 4,501
Investment in net liabilities
of Equity Investees(b) 476 -
Deferred income taxes - net 7 11
Other liabilities 475 2,948
--------------- --------------
Total long-term liabilities 999 7,460
Liabilities subject to compromise 6,921 -
--------------- --------------
Total liabilities 10,246 11,966
--------------- --------------
SHAREHOLDERS' DEFICIT
Common shares, without par value
- Authorized shares: unlimited; 35,597 35,593
Issued and outstanding shares:
497,946,541 as of September 30, 2009
and 497,893,086 as of December 31, 2008
Additional paid-in capital 3,644 3,547
Accumulated deficit (43,652) (42,362)
Accumulated other comprehensive income (931) (729)
--------------- --------------
Total Nortel Networks Corporation
shareholders' deficit (5,342) (3,951)
--------------- --------------
Noncontrolling interest 801 822
--------------- --------------
Total shareholders' deficit (4,541) (3,129)
--------------- --------------
Total liabilities and
shareholders' deficit $ 5,705 $ 8,837
--------------- --------------
--------------- --------------
(a) The ES business as well as the shares of NGS and DiamondWare, Ltd.
Associated are presented as discontinued operations for the quarter
ended September 30, 2009. Accordingly, comparative periods have been
recast to give effect for the change in presentation.
(b) Nortel has determined that, as of the Petition Date, the
presentation of the Equity Investees under the equity method of
accounting was more appropriate based on the conclusion that Nortel
exercises significant influence over those entities. The equity method
of accounting will result in the financial position and results of
operations of the Equity Investees being presented net on a single line
in the balance sheet and statement of operations, respectively, versus
being combined gross into each individual line item. The comparative
periods have not been recast for the change in accounting. As a result,
meaningful analysis to the comparative periods may be difficult.
NORTEL NETWORKS CORPORATION
(Under Creditor Protection Proceedings as of January 14, 2009)
Condensed Consolidated Statements of Cash Flows
(U.S. GAAP; Millions of U.S. dollars)
Three months ended Nine months ended
September 30, September 30, September 30, September 30,
2009 2008 2009 2008
--------------------------------------------------------------------------
Cash flows from
(used in) operating
activities
Net loss attributable
to Nortel Networks
Corporation $ (508) $ (3,413) $ (1,289) $ (3,664)
Net loss fron
discontinued
operations (a) $ 164 $ 556 $ 488 $ 745
Adjustments to
reconcile net
earnings (loss)
to net cash
from (used in)
operating activities,
net of effects from
acquisitions and
divestitures of
businesses:
Amortization and
depreciation 45 76 157 220
Goodwill impairment - 661 - 661
Non-cash portion of
cost reduction
activities 10 2 18 13
Equity in net
earnings of
associated
companies -
net of tax - - 1 (2)
Equity in net
loss of Equity
Investees (b) 159 - 448 -
Share-based
compensation
expense - 22 86 64
Deferred income
taxes 1 2,066 22 2,113
Pension and
other accruals 132 25 157 85
Loss (gain) on sales
of businesses and
sales and impairments
of assets 13 4 1 10
Income attributable
to non-controlling
interests -
net of tax 3 21 35 154
Reorganization
items - non cash 203 - 265 -
Other - net (249) (165) (529) (424)
Change in operating
assets and liabilities 143 (8) 379 (460)
-------------------- --------------------------
Net cash from (used in)
operating activities of
continuing operations 116 (153) 239 (485)
Net cash from (used in)
operating activities of
discontinued operations 8 9 (18) 7
--------------------- --------------------------
Net cash from (used in)
operating activities 124 (144) 221 (478)
--------------------- --------------------------
Cash flows from (used in)
investing activities
Expenditures for
plant and equipment (9) (36) (32) (104)
Proceeds on disposals
of plant and equipment - - 87 -
Change in restricted
cash and cash
equivalents (39) 14 (82) 23
Decrease (increase)
in short-term and
long-term investments - (362) 40 (362)
Acquisitions of
investments and
businesses - net of
cash acquired (1) (69) (1) (73)
Proceeds from sales
of investments and
businesses and
assets - net - (48) 6 (26)
--------------------- --------------------------
Net cash from
(used in) investing
activities of
continuing operations (49) (501) 18 (542)
Net cash from
(used in) investing
activities of
discontinued operations (1) (9) 13 (52)
--------------------- --------------------------
Net cash from
(used in) investing
activities (50) (510) 31 (594)
--------------------- --------------------------
Cash flows from
(used in) financing
activities
Dividends paid,
including paid by
subsidiaries to
noncontrolling
interests - (9) (6) (30)
Capital repayment
to noncontrolling
interests - - (29) -
Increase in
notes payable 13 38 36 116
Decrease in
notes payable (13) (37) (76) (107)
Proceeds from
issuance of
long-term debt - - - 668
Repayment of
long-term debt - - - (675)
Debt issuance costs - - - (13)
Repayments of
capital leases (2) (6) (7) (16)
Other financing
activities - - - -
--------------------- --------------------------
Net cash from
(used in) financing
activities of
continuing operations (2) (14) (82) (57)
Net cash from
(used in) financing
activities of
discontinued operations - - (1) (1)
---------------------- --------------------------
Net cash from
(used in) financing
activities (2) (14) (83) (58)
---------------------- --------------------------
Effect of foreign
exchange rate changes
on cash and cash
equivalents 41 (99) 51 (98)
---------------------- --------------------------
Net cash from (used in)
continuing operations 106 (767) 226 (1,182)
Net cash from (used in)
discontinued operations 7 - (6) (46)
---------------------- --------------------------
Net increase (decrease)
in cash and cash
equivalents 113 (767) 220 (1,228)
Cash and cash
equivalents at
beginning of
the period 1,743 3,071 2,397 3,532
Less cash and
cash equivalents
of Equity Investees - - (761) -
---------------------- --------------------------
Adjusted cash and
cash equivalents at
beginning of
the period 1,743 3,071 1,636 3,532
---------------------- --------------------------
Cash and cash
equivalents at
end of the period 1,856 2,304 1,856 2,304
Less cash and cash
equivalents of
discontinued
operations at
end of the period (38) (31) (38) (31)
---------------------- --------------------------
Cash and cash
equivalents of
continuing operations
at the end of
the period $ 1,818 $ 2,273 $ 1,818 $ 2,273
---------------------- --------------------------
---------------------- --------------------------
(a) The ES business as well as the shares of NGS and DiamondWare, Ltd.
Associated are presented as discontinued operations for the quarter
ended September 30, 2009. Accordingly, comparative periods have been
recast to give effect for the change in presentation.
(b) Nortel has determined that, as of the Petition Date, the
presentation of the Equity Investees under the equity method of
accounting was more appropriate based on the conclusion that Nortel
exercises significant influence over those entities. The equity method
of accounting will result in the financial position and results of
operations of the Equity Investees being presented net on a single line
in the balance sheet and statement of operations, respectively, versus
being combined gross into each individual line item. The comparative
periods have not been recast for the change in accounting. As a result,
meaningful analysis to the comparative periods may be difficult.
NORTEL NETWORKS CORPORATION
(Under Creditor Protection Proceedings as of January 14, 2009)
Consolidated Financial Information (unaudited)
(U.S. GAAP; Millions of U.S. dollars)
Segmented revenues
The following table summarizes our revenue and management operating margin
by segment. The financial information for our business segments includes
the results of the Equity Investees as if they were consolidated, which is
consistent with the way we manage our business segments.
Three months ended Nine months ended
--------------------------- --------------------------
September 30, September 30, September 30, September 30,
2009 2008 2009 2008
--------------------------------------------------------------------------
Segment Revenues
Wireless Networks $ 663 $ 805 $ 1,988 $ 2,614
Carrier VoIP and
Application Systems 208 182 540 605
Metro Ethernet
Networks 295 398 988 1,255
LG-Nortel 103 211 490 1,072
--------------------------- --------------------------
Total reportable
segments 1,269 1,596 4,006 5,546
Other 2 (1) 9 6
--------------------------- --------------------------
Total segment
revenues $ 1,271 $ 1,595 $ 4,015 $ 5,552
--------------------------- --------------------------
--------------------------- --------------------------
Segment Management
Operating Margin
Wireless Networks 195 92 475 414
Carrier VoIP and
Application Systems 20 (22) (5) (54)
Metro Ethernet
Networks 12 15 81 63
LG-Nortel 4 36 70 321
--------------------------- ---------------------------
Total reportable
segments 231 121 621 744
Other (214) (52) (623) (258)
--------------------------- ---------------------------
Total segment
management
operating margin 17 69 (2) 486
Impact of
deconsolidation
of Equity Investees (114) - (282) -
Amortization of
intangible assets 3 (7) 9 16
Goodwill impairment - 661 - 661
Special charges - 41 - 166
Loss (gain) on sale of
businesses and sales
and impairments of assets 15 (6) (1) (10)
Other operating
expense (income)
- net 46 15 46 33
--------------------------- ---------------------------
Total operating
earnings (loss) 67 (635) 226 (380)
Other income
(expense) - net 60 (14) 13 (11)
Interest and
dividend income - 27 - 95
Interest expense (75) (81) (225) (237)
Reorganization
items - net (223) - (284) -
Income tax expense (10) (2,133) (47) (2,234)
Equity in net earnings
(loss) of associated
companies - net of tax (1) - (1) 2
Equity in net loss of
Equity Investees (159) - (448) -
--------------------------- ---------------------------
Net loss from
continuing
operations $ (341) $ (2,836) $ (766) $ (2,765)
--------------------------- ---------------------------
--------------------------- ---------------------------
Geographic revenues
The following table summarizes our geographic revenues based on the
location of the customer for:
Three months ended Nine months ended
--------------------------- --------------------------
September 30, September 30, September 30, September 30,
2009 2008 2009 2008
--------------------------- --------------------------
Revenues
United States $ 736 $ 589 $ 1,986 $ 2,006
EMEA (a) 10 369 30 1,190
Canada 82 93 238 362
Asia 162 424 840 1,639
CALA (b) 55 120 200 355
--------------------------- --------------------------
Total revenues $ 1,045 $ 1,595 $ 3,294 $ 5,552
--------------------------- --------------------------
--------------------------- --------------------------
(a) Europe, Middle East and Africa
(b) Caribbean and Latin America
Network Solutions revenues
The following table summarizes our revenue and management operating margin
by segment. The financial information for our business segments includes
the results of the Equity Investees as if they were consolidated, which is
consistent with the way we manage our business segments.
Three months ended Nine months ended
--------------------------- --------------------------
September 30, September 30, September 30, September 30,
2009 2008 2009 2008
--------------------------- --------------------------
Segment Revenues
Wireless Networks
CDMA solutions $ 452 $ 432 $ 1,400 $ 1,533
GSM and UMTS
solutions 211 373 588 1,081
--------------------------- --------------------------
663 805 1,988 2,614
Carrier VoIP and
Application Systems
Circuit and packet
voice solutions 208 182 540 605
Metro Ethernet
Networks
Optical networking
solutions 241 303 781 955
Data networking and
security solutions 54 95 207 300
--------------------------- --------------------------
295 398 988 1,255
LG-Nortel
LGN Carrier 55 151 362 862
LGN Enterprise 48 60 128 210
--------------------------- --------------------------
103 211 490 1,072
Other 2 (1) 9 6
--------------------------- --------------------------
Total segment
revenues $ 1,271 $ 1,595 $ 4,015 $ 5,552
--------------------------- --------------------------
--------------------------- --------------------------
Contacts:
Nortel
Jay Barta
Media
(972) 685-2381
jbarta@nortel.com
Nortel
Investors
(888) 901-7286 or (905) 863-6049
investor@nortel.com
www.nortel.com
에릭슨 코리아 사장의 인터뷰 기사가 11월 16일자 디지털 타임즈 기사에 실렸네요.
에릭슨이 한국 시장을 바라보는 뷰가 나와 있습니다.
과연 에릭슨이 LG노텔을 인수할까?
=================================================================================
"한국 컴피턴스 R&D센터 세계 최대규모 육성 검토"
 |
 LGBI1068-44_20091124132948.pdf
 신한20091120.zip.001


